Prathama Line

Air Cargo Demand up 8.2% in November 2024 – 16th Month of Consecutive Growth

Geneva – The International Air Transport Association (IATA) released data for November 2024 global air cargo markets showing:

  • Total demand, measured in cargo tonne-kilometers (CTK), rose by 8.2% compared to November 2023 levels (9.5% for international operations) for a 16th consecutive month of growth.
  • Capacity, measured in available cargo tonne-kilometers (ACTK), increased by 4.6% compared to November 2023 (6.5% for international operations).

“It was a good November for air cargo with 8.2% demand growth nearly doubling the 4.6% growth in cargo capacity. Fuel costs tracked at 22% below previous-year levels and tight market conditions supported yield growth at 7.8%. All things considered we are looking to close out 2024 air cargo performance on a profitable note. While this strong performance is very likely to extend into 2025, there are some downside risks that must be carefully watched. These include inflation, geopolitical uncertainties and trade tensions,” said Willie Walsh, IATA’s Director General.

Several factors in the operating environment should be noted:

  • Year-on-year, industrial production rose 2.1% in October. Global goods trade grew for a seventh consecutive month, reporting a 1.6% increase.
  • The Purchasing Managers Index (PMI) for global manufacturing output was above the 50-mark for November, indicating growth. However, the PMI for new export orders remained below the 50-mark, suggesting ongoing uncertainty and weakness in global trade.
  • US headline inflation, based on the annual Consumer Price Index (CPI), rose by 0.1 percentage points to 2.7% in November. In the same month, the inflation rate in the EU increased by 0.2 percentage points to 2.5%. China’s consumer inflation fell to 0.2% in November, continuing concerns of an economic slowdown.

Air cargo market in detail – November 2024

November 2024

(% year-on-year)             World share1     CTK        ACTK     CLF (%-pt)           CLF (level)

Total Market      100%     8.2%      4.6%      1.6%      49.0%

Africa    2.0%      -0.7%     0.4%      -0.5%     42.5%

Asia Pacific          33.3%    13.2%    9.4%      1.7%      50.0%

Europe 21.4%    5.6%      4.3%      0.7%      57.6%

Latin America     2.8%      11.6%    6.4%      1.9%      39.6%

Middle East        13.5%    3.6%      -0.6%     2.0%      49.4%

North America  26.9%    6.9%      2.2%      1.9%      43.8%

1% of industry CTKs in 2023

Asia-Pacific airlines saw 13.2% year-on-year demand growth for air cargo in November, the strongest growth among the regions. Capacity increased by 9.4% year-on-year.

North American carriers saw 6.9% year-on-year demand growth for air cargo in November. Capacity increased by 2.2% year-on-year.

European carriers saw 5.6% year-on-year demand growth for air cargo in November. Capacity increased 4.3% year-on-year.

Middle Eastern carriers saw 3.6% year-on-year demand growth for air cargo in November. Capacity decreased by 0.6% year-on-year.

Latin American carriers saw 11.6% year-on-year demand growth for air cargo in November. Capacity increased 6.4% year-on-year.

African airlines saw a 0.7% year-on-year decrease in demand for air cargo in November, the slowest among regions. Capacity increased by 0.4% year-on-year.

Trade Lane Growth: International routes experienced exceptional traffic levels for the 16th consecutive month with a 9.5% year-on-year increase in November. Airlines are benefiting from rising e-commerce demand in the US and Europe amid ongoing capacity limits in ocean shipping.

Trade Lane          YOY Growth       Notes    Market Share of Industry*

Asia-North America        +13%     13 consecutive months of growth            24.90%

Europe-Asia       +12.9% 21 consecutive months of growth            19.60%

Middle East-Europe        +9.9%    16 consecutive months of growth            5.00%

Middle East-Asia              +9.0%    18 consecutive months of growth            7.20%

Within Asia         +12.2% 13 consecutive months of growth            6.70%

North America-Europe  +5.6%    13 consecutive months of growth            14.20%

Africa-Asia          +7.6%    15 consecutive months of growth            1.20%

Supply Chain Issues Continue to Negatively Impact Airline Performance into 2025

10 December 2024

Geneva – The International Air Transport Association (IATA) expects severe supply chain issues to continue to impact airline performance into 2025, raising costs and limiting growth.

IATA quantified the scale of the challenges facing airlines because of supply chain issues in its latest airline industry outlook:

  • Average age of the global fleet has risen to a record 14.8 years, a significant increase from the 13.6 years average for the period 1990-2024.
  • Aircraft deliveries have fallen sharply from the peak of 1,813 aircraft in 2018. The estimate for 2024 deliveries is 1,254 aircraft, a 30% shortfall on what was predicted going into the year. In 2025, deliveries are forecast to rise to 1,802, well below earlier expectation for 2,293 deliveries with further downward revisions in 2025 widely seen as quite possible.
  • The backlog (cumulative number of unfulfilled orders) for new aircraft has reached 17,000 planes, a record high. At present delivery rates, this would take 14 years to fulfil, double the six-year average backlog for the 2013-2019 period. However, the waiting time is expected to shorten as delivery rates increase.
  • The number of “parked” aircraft is 14% (approximately 5,000 aircraft) of the total fleet (35,166 as at December 2024, including Russian-built aircraft). While this has improved recently, parked aircraft remain 4 percentage points higher than pre-pandemic levels (equivalent to some 1,600 aircraft). Of these, 700 (2% of the global fleet) are parked for engine inspections. We expect this situation to persist into 2025.

“Supply chain issues are frustrating every airline with a triple whammy on revenues, costs, and environmental performance.  Load factors are at record highs and there is no doubt that if we had more aircraft they could be profitably deployed, so our revenues are being compromised. Meanwhile, the aging fleet that airlines are using has higher maintenance costs, burns more fuel, and takes more capital to keep it flying. And, on top of this, leasing rates have risen more than interest rates as competition among airlines intensified the scramble to find every way possible to expand capacity. This is a time when airlines need to be fixing their battered post-pandemic balance sheets, but progress is effectively capped by supply chain issues that manufacturers need to resolve,” said Willie Walsh, IATA’s Director General.

Specifically, IATA noted that, persistent supply chain issues at least partially responsible for two negative developments:

  • Fuel efficiency (excluding the impact of load factors) was unchanged between 2023 and 2024 at 0.23 litres/100 available tonne kilometers (ATK). This is a step back from the long-term (1990-2019) trend of annual fuel efficiency improvements in the range of 1.5-2.0%.
  • Exceptional demand for leased aircraft pushed leasing rates for narrow body aircraft to levels 20-30% higher than in 2019.

“The entire aviation sector is united in its commitment to achieving net zero carbon emissions by 2050. But when it comes to the practicality of actually getting there, airlines are left bearing the biggest burden. The supply chain issues are a case in point. Manufacturers are letting down their airline customers and that is having a direct impact of slowing down airlines’ efforts to limit their carbon emissions. If the aircraft and engine manufacturers could sort out their issues and keep their promises, we’d have a more fuel-efficient fleet in the air,” said Walsh.

Disappointingly Slow Growth in SAF Production

10 December 2024

Geneva – The International Air Transport Association (IATA) released new estimates for Sustainable Aviation Fuel (SAF) production showing that:

  • In 2024, SAF production volumes reached 1 million tonnes (1.3 billion liters), double the 0.5 million tonnes (600 million liters) produced in 2023. SAF accounted for 0.3% of global jet fuel production and 11% of global renewable fuel*.
  • This is significantly below previous estimates that projected SAF production in 2024 at 1.5 million tonnes (1.9 billion liters), as key SAF production facilities in the US have pushed back their production ramp up to the first half of 2025.
  • In 2025, SAF production is expected to reach 2.1 million tonnes (2.7 billion liters) or 0.7% of total jet fuel production and 13% of global renewable fuel capacity*.

“SAF volumes are increasing, but disappointingly slowly. Governments are sending mixed signals to oil companies which continue to receive subsidies for their exploration and production of fossil oil and gas. And investors in new generation fuel producers seem to be waiting for guarantees of easy money before going full throttle. With airlines, the core of the value chain, earning just a 3.6% net margin, profitability expectations for SAF investors need to be slow and steady, not fast and furious. But make no mistake that airlines are eager to buy SAF and there is money to be made by investors and companies who see the long-term future of decarbonization. Governments can accelerate progress by winding down fossil fuel production subsidies and replacing them with strategic production incentives and clear policies supporting a future built on renewable energies, including SAF,” said Willie Walsh, IATA’s Director General.

Aviation is part of the global energy transition

“The airline industry’s decarbonization must be seen as part of the global energy transition, not compartmentalized as a transport issue. That’s because solving the energy transition challenge for aviation will also benefit the wider economy, as renewable fuel refineries will produce a broad range of fuels used by other industries, and only a minor share will be SAF, used by airlines. We need the whole world to produce as much renewable energy as possible for everybody. Airlines simply want to access their fair share of that output,” said Marie Owens Thomsen, IATA’s Senior Vice President Sustainability and Chief Economist.

To reach net zero CO2 emissions by 2050, IATA analysis shows that between 3,000 to over 6,500 new renewable fuel plants will be needed. These will also produce renewable diesel and other fuels for other industries. The annual average capex needed to build the new facilities over the 30-year period is about $128 billion per year, in a best-case scenario. Importantly, this amount is significantly less than the estimated total sum of investments in the solar and wind energy markets at $280 billion per annum between 2004 and 2022.

“Governments must quickly deliver concrete policy incentives to rapidly accelerate renewable energy production. There is already a model to follow with the transition to wind and solar power. The good news is that the energy transition, which includes SAF, will need less than half the annual investments that realizing wind and solar production at scale required. And a good portion of the needed funding could be realized by redirecting a portion of the retrograde subsidies that governments give to the fossil fuel industry,” said Walsh.

Short Term Measures

Progress on expanding SAF production and use could be accelerated in three critical ways:

  • Increase co-processing: Existing refineries can be used to co-process up to 5% of approved renewable feedstocks alongside the crude oil streams. This solution can be implemented quickly and requires minimal material investments. It should urgently be expanded by allowing a greater amount of renewable feedstock to be co-processed. By 2050, co-processing could save $347 billion in capex as more than 260 new renewable fuel plants would not need to be built.
  • Diversify SAF production: There are 11 certified pathways to make SAF, but the HEFA method (hydrotreated esters fatty acids (used cooking oil, animal fats etc.)) accounts for around 80% of production in the next five years. SAF volumes could be boosted by increasing investments to scale up production through the other certified pathways, in particular Alcohol-to-Jet (AtJ) and Fischer-Tropsch (FT), which use biological and agricultural wastes and residue.
  • Create a global SAF accounting framework: It is essential to have a registry that allows airlines to benefit from the environmental attributes of their SAF purchases and to be able to claim these against their obligations in a transparent manner that prevents double counting. Such a registry is necessary for achieving a global SAF market where all airlines can buy SAF, and all SAF producers can sell their fuel to airlines.

Passenger Support

A recent IATA survey revealed significant public support for SAF. Some 86% of travelers agreed that governments should provide production incentives for airlines to be able to access SAF. In addition, 86% agreed that it should be a priority for oil companies to supply SAF to airlines.

$1.7 Billion in Airline Funds Blocked by Governments


$1.7 Billion in Airline Funds Blocked by Governments

9 December 2024

Geneva – The International Air Transport Association (IATA) reported that $1.7 billion in airline funds are blocked from repatriation by governments as of the end of October 2024. This is a small improvement compared to the $1.8 billion reported at the end of April.

“Over the last six months, we have seen significant reductions in blocked funds in Pakistan, Bangladesh, Algeria and Ethiopia. At the same time, amounts are rising in the XAF /XOF  zones and Mozambique. Bolivia has also emerged as a problem, where repatriating sales revenues is becoming increasingly difficult and unsustainable for airlines. This unfortunate game of ‘whack-a-mole’ is unacceptable.  Governments must remove all barriers for airlines to repatriate their revenues from ticket sales and other activities in accordance with international agreements and treaty obligations,” said Willie Walsh, IATA’s Director General.

“No country wants to lose aviation connectivity, which drives economic prosperity. But if airlines cannot repatriate their revenues, they cannot be expected to provide a service. Economies will suffer if connectivity collapses. So, it is in everyone’s interest, including governments, to ensure that airlines can repatriate their funds smoothly,” said Walsh.

Nine countries account for 83% of the airline industry’s blocked funds, amounting to $1.43 billion.

1 Cameroon, Central African Republic, Chad, Republic of the Congo, Equatorial Guinea, and Gabon

2 Benin, Burkina Faso, Ivory Coast, Guinea-Bissau, Mali, Niger, Senegal, and Togo.


Country                Amount US$ Million        Months held

Pakistan               $311       48

XAF Zone             $235       60

Bangladesh         $196       47

Algeria  $193       24

Lebanon              $142       60

Mozambique     $127       47

Angola  $80         36

Eritrea   $75         96

XOF Zone            $73         12

Country Highlights

Pakistan continues to top the list of blocked funds countries at $311 million. This is an improvement from $411 million in April 2024. The main issue is the system of audit and tax exemption certificates which is causing long processing delays.

Bangladesh has seen the amount of blocked funds decrease to $196 million (from $320 million in April). The Central Bank needs to continue to prioritize airlines’ access to foreign exchange in line with international treated obligations.

About $1 billion of airline money blocked from repatriation is in African countries. That is about 59% of the global tally. Over the last six months, there were significant reductions in blocked funds in Algeria ($193 million from $286 million April) and Ethiopia ($43 million from $149 million in April). At the same time, XAF Zone (+$84 million), Mozambique (+$84 million) and XOF Zone (+$73 million) contributed to the largest increases.

Bolivia is new to the list of blocked fund countries. A further deterioration in the availability of foreign exchange, particular the US dollar, has resulted in an estimated $42 million in airline funds being blocked in the country.

Air Cargo Demand up 9.8% in October 2024 – 15th Month of Consecutive Growth

3 December 2024            No. 54

Geneva – The International Air Transport Association (IATA) released data for October 2024 global air cargo markets showing continuing strong annual growth in demand.

  • Total demand, measured in cargo tonne-kilometers (CTKs*), rose by 9.8% compared to October 2023 levels (10.3% for international operations) for a 15th consecutive month of growth.
  • Capacity, measured in available cargo tonne-kilometers (ACTKs), increased by 5.9% compared to October 2023 (7.2% for international operations). This was largely driven by an 8.5% increase in international belly capacity. Dedicated freighter capacity increased by 5.6%, the seventh consecutive month of growth with volumes nearing 2021 peak levels.

“Air cargo markets continued their strong performance in October, with demand rising 9.8% year-on-year and capacity up 5.9%. Global air cargo yields (including surcharges) continue to rise, up 10.6% on 2023 and 49% on 2019 levels. While 2024 is shaping up to be a banner year for air cargo, we must look to 2025 with some caution. The incoming Trump Administration’s announced intention to impose significant tariffs on its top trading partners—Canada, China and Mexico—has the potential to upend global supply chains and undermine consumer confidence. The air cargo industry’s proven adaptability to rapidly evolving geopolitical and economic situations is likely to be tested as the Trump agenda unfolds,” said Willie Walsh, IATA’s Director General.

Several factors in the operating environment should be noted:

  • Year-on-year, industrial production rose 1.6% in September while global goods trade increased 2.4% for a sixth consecutive month of growth. The increase in trade is partly due to businesses stockpiling inventory ahead of potential disruptions, like the US port strike.
  • Global manufacturing activity rebounded in October. The Purchasing Managers Index (PMI) for global manufacturing output was above the 50-mark, indicating growth. However, the PMI for new export orders, remained below the 50-mark, suggesting ongoing uncertainty and weakness in global trade.
  • US headline inflation, based on the annual Consumer Price Index (CPI), rose by 0.17 percentage points to 2.58% in October, ending a six-month decline. In the same month, the inflation rate in the EU increased by 0.24 percentage points to 2.33%. China’s consumer inflation fell to 0.29% in October, sparking concerns of an economic slowdown.

Air cargo market in detail – October 2024

October 2024

(% year-on-year)             World share1     CTK        ACTK     CLF (%-pt)           CLF (level)

Total Market      100%     9.8%      5.9%      1.7%      47.3%

Africa    2.0%      1.6%      7.7%      -2.4%     40.1%

Asia Pacific          33.3%    13.4%    9.3%      1.8%      49.3%

Europe 21.4%    7.6%      3.9%      1.9%      55.5%

Latin America     2.8%      18.5%    5.8%      4.4%      41.1%

Middle East        13.5%    4.5%      0.8%      1.7%      48.0%

North America  26.9%    9.5%      5.8%      1.4%      41.1%

1% of industry CTKs in 2023

October Regional Performance

Asia-Pacific airlines saw 13.4% year-on-year demand growth for air cargo in October. Capacity increased by 9.3% year-on-year.

North American carriers saw 9.5% year-on-year demand growth for air cargo in October. Capacity increased by 5.8% year-on-year.

European carriers saw 7.6% year-on-year demand growth for air cargo in October. Capacity increased 3.9% year-on-year.

Middle Eastern carriers saw 4.5% year-on-year demand growth for air cargo in October. Capacity increased 0.8% year-on-year.

Latin American carriers saw 18.5% year-on-year demand growth for air cargo in October, the strongest growth among the regions. Capacity increased 5.8% year-on-year.

African airlines saw 1.6% year-on-year demand growth for air cargo in October, the slowest among regions. Capacity increased by 7.7% year-on-year.

Trade Lane Growth: International routes experienced exceptional traffic levels for the fifth consecutive month with a 10.3% year-on-year increase in October. Airlines are benefiting from rising e-commerce demand in the US and Europe amid ongoing capacity limits in ocean shipping.

Trade Lane          Growth                Notes    Share*

Asia-North America        +8.6%    12 consecutive months of growth            25.00%

Europe-Asia       +14.3% 20 consecutive months of growth            19.40%

Middle East-Europe        +15.3% 15 consecutive months of growth            5.00%

Middle East-Asia              +9.0%    17 consecutive months of growth            7.20%

Within Asia         +15%     12 consecutive months of growth            6.70%

North America-Europe  +8.6%    12 consecutive months of growth            14.30%

Africa-Asia          +13.3% 14 consecutive months of growth            1.26%


Saudia Cargo wins “Best E-Commerce Carrier of the Year-Middle East” at 2024 Payload Asia Awards

October 23, 2024 by Payload Asia

Saudia Cargo, the leading air cargo carrier, was awarded the prestigious “Best E-commerce Carrier of the Year-Middle East” title for the second consecutive year at the Payload Asia Awards. This recognition underscores the company’s outstanding performance in e-commerce logistics and its essential role in facilitating the global movement of e-commerce shipments.

Additionally, the company’s strategic partnerships with industry leaders such as Cainiao, Alibaba’s logistics arm, have been instrumental in optimizing operations and meeting the growing demand for fast, reliable e-commerce logistics solutions. The expansion this year with a direct route from Shenzhen, China, further cemented Saudia Cargo’s position in one of the world’s most significant e-commerce markets. By 2024, Saudia Cargo will operate across all major e-commerce hubs globally, enhancing its ability to meet rising consumer demands and maintain its leadership in the industry.

Teddy Zebitz, CEO of Saudia Cargo, stated: “We are honored to receive this award for the second consecutive year. It reflects our team’s dedication to excellence and commitment to exceptional service. Our agile approach and consistent industry record high aircraft on-time performance have been key in connecting e-commerce platforms with their customers worldwide, especially during peak periods.”

“In 2023, Saudia Cargo further strengthened its position as a global e-commerce leader by expanding our network, increasing flight frequencies to major hubs like Hong Kong with over 16 weekly flights, and successfully operating more than 100 e-commerce charters. In 2024, we also significantly expanded our presence in mainland China. This growth is reflected in our 25% year-over-year increase in e-commerce volumes, all delivered on time to our customers,” he added.

Saudia Cargo is dedicated to supporting Saudi Arabia’s Vision 2030 by driving economic diversification and playing a pivotal role in the projected 50% increase in average e-commerce spending per user in the Kingdom over the next three years. Through strategic collaborations and ongoing innovation, Saudia Cargo continues to lead the logistics industry, facilitating trade and connecting global markets with the Kingdom.

Other Topics: 11th Paayload Asia Awards, Air Cargo Network, Air Express, Air Freight Services, Air Logistics, Asia Pacific Air Cargo, Asia Pacific Air Freight, Asia Pacific Air Logistics, Asia Pacific Shipments, Cainiao, Cargo Flights, E-Commerce Logistics, Express Delivery, Express Logistics, International Air Shipments, International Express Delivery, Saudia Cargo, Transpacific Air Cargo, Transpacific Air Freight

Passenger Demand Up 8.6% in August. Load Factor Reaches Record High

Passenger Demand Up 8.6% in August. Load Factor Reaches Record High

3 October 2024

Geneva – The International Air Transport Association (IATA) released data for August 2024 global passenger demand with the following highlights:

  • Total demand, measured in revenue passenger kilometers (RPK), was up 8.6% compared to August 2023. Total capacity, measured in available seat kilometers (ASK), was up 6.5% year-on-year. The August load factor was 86.2% (+1.6ppt compared to August 2023), a new record high.
  • International demand rose 10.6% compared to August 2023. Capacity was up 10.1% year-on-year and the load factor rose to 85.7% (+0.4ppt compared to August 2023).
  • Domestic demand rose 5.6% compared to August 2023. Capacity was up 1.2% year-on-year and the load factor was 86.9% (+3.6ppt compared to August 2023).

“The market for air travel is hot and airlines are doing a great job at meeting the growing demand for travel. Efficiency gains have driven load factors to record highs while the 6.5% capacity increase demonstrates resilience in the face of persistent supply chain issues and infrastructure deficiencies,” said Willie Walsh, IATA’s Director General.

“Looking ahead, the continued strong demand growth signals that we could be fast approaching an infrastructure capacity crunch that would restrict connectivity and choice for passengers and businesses. If governments want to maximize the benefits of aviation, they must take bold decisions to ensure sufficient infrastructure capacity. And, in the interim, both airports and air navigation service providers need to do more with the resources they currently have. In particular, the variance in declared capacity of airports with broadly the same infrastructure needs to be resolved, with airports emulating the best performers. The industry cannot afford to under-utilize the airport infrastructure that we have,” said Walsh.

Air passenger market in detail – August 2024

August 2024

(% year-on-year)             World share1     RPK        ASK        PLF (%-pt)           PLF (level)

Total Market      100%     8.6%      6.5%      1.6%      86.2%

Africa    2.1%      9.6%      6.7%      2.1%      77.9%

Asia Pacific          31.7%    13.4%    8.7%      3.6%      86.0%

Europe 27.1%    7.8%      7.3%      0.4%      87.9%

Latin America     5.5%      6.5%      8.1%      -1.3%     84.0%

Middle East        9.4%      5.0%      5.9%      -0.7%     82.3%

North America  24.2%    4.8%      2.4%      2.0%      87.1%

1% of industry RPKs in 2023

Regional Breakdown – International Passenger Markets

All regions showed growth for international passenger markets in August 2024 compared to August 2023. Ticket sales in May-July for travel in August-September showed a 6.6% year-on-year increase, which bodes well for further strong growth this year.

Asia-Pacific airlines achieved a 19.9% year-on-year increase in demand. Capacity increased 18.8% year-on-year and the load factor was 85.2% (+0.8ppt compared to August 2023). Asia-Pacific is still growing robustly and is now just 8 percentage points from full recovery to pre-pandemic volumes.

European carriers saw a 9.1% year-on-year increase in demand. Capacity increased 8.5% year-on-year, and the load factor was 87.2% (+0.5ppt compared to August 2023). The Europe-Asia route was by far the fastest-growing, but it is still markedly below its 2019 peak.

Middle Eastern carriers saw a 4.9% year-on-year increase in demand. Capacity increased 5.6% year-on-year and the load factor was 82.5% (-0.6ppt compared to August 2023).

North American carriers saw a 4.3% year-on-year increase in demand. Capacity increased 3.8% year-on-year, and the load factor was 88.2% (+0.4 ppt compared to August 2023), the highest among regions.

Latin American airlines saw a 13.6% year-on-year increase in demand. Capacity climbed 15.2% year-on-year. The load factor was 85.1% (-1.2ppt compared to August 2023).

African airlines saw a 10.1% year-on-year increase in demand. Capacity was up 7.3% year-on-year. The load factor rose to 77.8% (+2.0ppt compared to August 2023).

Domestic markets

Domestic demand increased in August, with growth in all key markets, especially China. Domestic ticket sales for August-September grew 4.3% year-on-year, underpinning solid growth prospects for the rest of the year.

Air passenger market in detail – August 2024

August 2024

(% year-on-year)             World share1     RPK        ASK        PLF (%-pt)           PLF (level)

Domestic             39.9%    5.6%      1.2%      3.6%      86.9%

Dom. Australia  0.8%      4.9%      0.7%      3.5%      87.1%

Dom. Brazil         1.2%      4.9%      6.7%      -1.4%     81.7%

Dom. China P.R.                11.2%    10.7%    1.4%      7.3%      86.3%

Dom. India          1.8%      5.0%      7.3%      -1.8%     82.9%

Dom. Japan        1.1%      7.6%      2.0%      4.5%      87.2%

Dom. US              15.4%    5.5%      1.9%      2.9%      86.2%

1% of industry RPKs in 2023

Note: the six domestic passenger markets for which broken-down data are available account for approximately 31.4% of global total RPKs and 78.8% of total domestic RPKs

>Read the latest Passenger Market Analysis


US ports strike causes first shutdown in 50 years

Natalie Sherman

Business reporter, BBC News

Reporting fromNew York

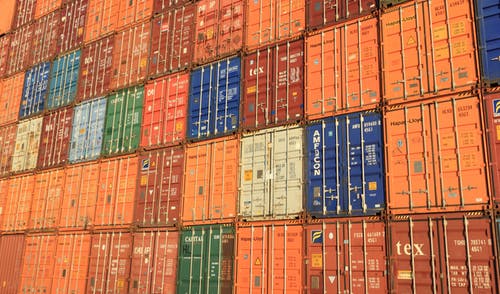
Getty Images Shipping containers stacked high at the Port of Houston Authority on September 20, 2024 in Harris County, Texas.Getty Images

Tens of thousands of dockworkers have gone on strike indefinitely at ports across much of the US, threatening significant trade and economic disruption ahead of the presidential election and the busy holiday shopping season.

Members of the International Longshoremen’s Association (ILA) walked out on Tuesday at 14 major ports along the east and gulf coasts, halting container traffic from Maine to Texas.

The action marks the first such shutdown in almost 50 years.

President Joe Biden has the power to suspend the strike for 80 days for further negotiations, but the White House has said he is not planning to act.

What is the strike about?

Talks have been stalled for months and the current contract between parties expired on Monday.

The White House said that President Biden and Vice President Kamala Harris were monitoring the strike closely.

“The President has directed his team to convey his message directly to both sides that they need to be at the table and negotiating in good faith – fairly and quickly.”

The two sides are fighting over a six-year master contract that covers about 25,000 port workers employed in container and roll-on/roll-off operations, according to the US Maritime Alliance, known as USMX, which represents shipping firms, port associations and marine terminal operators.

On Monday, USMX said it had increased its offer, which would raise wages by almost 50%, triple employers’ contributions to pension plans and strengthen health care options.

Union boss Harold Daggett has called for significant pay increases for his members, while voicing concerns about threats from automation.

USMX has accused the union of refusing to bargain, filing a complaint with labour regulators that asked them to order the union back to the table.

Under the previous contract, starting wages ranged from $20 to $39 per hour, depending on a worker’s experience. Workers also receive other benefits, such as bonuses connected to container trade.

Mr Daggett has indicated the union wants to see per-hour pay increase by five dollars per year over the life of the six-year deal, which he estimated amounted to about 10% per year.

The ILA said workers are owed after shipping firm profits soared during the Covid pandemic, while inflation hit salaries. It has warned to expect a wider strike of its members, including those not directly involved in this dispute, though the exact numbers are unclear.

The union has said it represents more than 85,000 people; it claimed about 47,000 active members in its annual report to the Labor Department.

What items will be affected by the strike?

Time-sensitive imports, such as food, are likely to be among the goods first impacted.

The ports involved handle about 14% of agricultural exports shipped by sea and more than half of imports, including a significant share of trade in bananas and chocolate, according to the Farm Bureau.

Other sectors exposed to disruption include tin, tobacco and nicotine, Oxford Economics said. Clothing and footwear firms, and European carmakers, which route many of their shipments through the Port of Baltimore, will also take a hit.

Imports in the US surged over the summer, as many businesses took steps to rush shipments ahead of the strike.

“I don’t think we will see immediate, significant economic impacts…but over the course of weeks, if the strike lasts that long, we can begin to see prices rise and for there to be some shortages in goods,” said Seth Harris, a professor at Northeastern University and a former White House adviser on labour issues.

What will the economic impact be?

More than a third of exports and imports could be affected by the strike, hitting US economic growth to the tune of at least $4.5bn each week of the strike, according to Grace Zemmer, an associate US economist at Oxford Economics, though others have estimated the economic hit could be higher.

She said more than 100,000 people could find themselves temporarily out of work as the impact of the stoppage spreads.

“This is really a trigger event, one that will see dominoes fall over the coming months,” said Peter Sand, chief analyst at ocean freight analytics firm Xeneta, warning that the stand-off also has the potential push up wider shipping costs.

That would hit consumers and businesses which tend to rely on so-called “just-in-time” supply chains for goods, he added.

How could this affect the US election?

The stand-off marks the first time since 1977 that the ILA has gone on strike and injects uncertainty into the US economy at a delicate time.

The economy has been slower and the unemployment rate is ticking higher as the US election approaches in six weeks.

The strike risks putting President Biden in a tricky spot.

US presidents can intervene in labour disputes that threaten national security or safety by imposing an 80-day cooling-off period, forcing workers back on the job while negotiations continue.

In 2002, Republican President George W Bush intervened to open ports after 11 days of a strike action by dockworkers on the west coast, who are represented by a different union.

The US Chamber of Commerce business group has called on President Biden to take action.

“Americans experienced the pain of delays and shortages of goods during the pandemic-era supply chain backlogs in 2021. It would be unconscionable to allow a contract dispute to inflict such a shock to our economy,” said Suzanne P. Clark, president and chief executive of the business group.

The ILA’s Mr Daggett endorsed Democrat Biden in 2020, but has been critical of the president more recently, citing pressure on west coast dockworkers to reach a deal a year ago. He met with Donald Trump last year.

Although any strike chaos is likely to hurt Democrats, the cost of alienating allies in the labour movement just weeks before the election would be greater, said William Brucher, a professor of labor studies and employment relations at Rutgers University.

But public support of strikes could be tested by the dispute, which has been championed by Mr Daggett, who was acquitted of having links to organised crime in a 2004 case by federal prosecutors. A related civil suit remains unresolved.

Films such as the 1954 classic crime drama On the Waterfront, starring Marlon Brando, once defined the union’s image, but Prof Brucher said he thought that historical memory had largely faded and many people shared the dockworkers’ concerns about cost-of living and automation.

“As much as it could sway public opinion against the ILA, a strike by ILA members is their decision and I don’t think they will be swayed by public opinion in any meaningful way,” he said.

“What is more likely to happen is the pressure of a strike will likely force the employers back to the table with a much more substantial offer.”

IATA Announces EEU Procurement Event for Airlines


IATA Announces EEU Procurement Event for Airlines

Miami – The International Air Transport Association (IATA) announced at its World Sustainability Symposium that airlines will have the opportunity to buy Eligible Emissions Units (EEU) at a bespoke Procurement Event scheduled for the last quarter of 2024 on the Aviation Carbon Exchange (ACE). This event is being organized by IATA with the State of Guyana, Mercuria, and Xpansiv and is open to all airlines.

The EEUs on offer will be useable by airlines in fulfilling their Carbon Offsetting and Reduction Scheme for International Aviation (CORSIA) Phase 1 offsetting obligations. These obligations cover traffic for the period 2024-2026. The EEUs must be canceled by 31 January 2028.

The event provides  an important procurement opportunity amidst ongoing scarcity of CORSIA eligible EEUs. At present, the State of Guyana is the only source of such EEUs. IATA estimates that airlines will need between 64 and 162 million EEUs for Phase 1 of CORSIA, depending on how traffic evolves. Guyana has already made sales from the 7 million issued EEUs and uncommitted volume will be available at the Procurement Event. “This is the first time such an event is being organized, and it couldn’t come sooner. States agreed to CORSIA, but so far Guyana is the only country fulfilling its obligation to make the needed carbon credits available. CORSIA is critical to aviation’s decarbonization efforts, and this event will be a clarion call that states need to make it possible for airlines to comply by releasing the requisite EEUs,” said Marie Owens Thomsen, IATA’s Senior Vice President Sustainability and Chief Economist.

This event is an important step in the development of an efficient market for EEUs, the early release of which (ahead of reporting deadlines) is essential to promoting liquidity and transparency, and to preventing a late rush on limited supply that would likely add significant costs to airlines’ decarbonization with no additional benefits.

“It takes a lot of effort to build the capabilities for generating CORSIA-eligible EEUs. Guyana is proud to be contributing, but we also want to see a large, active market. Many other countries have made progress towards creating credit supply, but before they commit to going further, they are waiting to see if the market delivers results. As the first mover in the market, we want to prove to other countries that it’s in their best interests to move forward. They should feel confident that they will receive fair prices for their credits and that accelerating the remaining work is worthwhile. This procurement event provides a further chance to create that confidence,” said Pradeepa Bholanath, Senior Director, Climate Change, Ministry of Natural Resources of the Government of Guyana.

About EEUs

Under CORSIA, airlines must purchase and cancel “emissions units” to offset the increase in CO2 emissions covered by the scheme. To maximize CO2 emission reductions under CORSIA, states must offer sufficient quantities of EEUs. The carbon offset credits that meet certain criteria defined by the International Civil Aviation Organization (ICAO) are called CORSIA EEUs and they are calculated to equate to one tonne of CO2 emissions generated through emissions reduction programs that comply with the strict eligibility criteria approved by ICAO. At the same time, the host countries must authorize the usage of those units for the purpose of CORSIA by conducting corresponding adjustments, to ensure those EEUs are not double claimed as part of a country’s Nationally Determined Contribution (NDC) under the UNFCCC Paris Agreement.

About ACE

The IATA Aviation Carbon Exchange, or ACE, is a centralized marketplace for CORSIA eligible emission units where airlines and other aviation stakeholders can trade CO2 emission reductions for compliance or voluntary offsetting purposes. The exchange is powered by Xpansiv’s CBL spot trading platform, providing a secure, intuitive destination for airlines to access real-time data with full price transparency.

Airlines trading on ACE benefit from IATA ‘s Financial Settlement Systems and Clearing House for seamless and risk-free settlement of funds. The exchange is open to all airlines, IATA and non-IATA members, and other aviation stakeholders including airports and aircraft manufacturers. Furthermore, the exchange is also accessible to carbon market participants wanting to list emissions reduction that are CORSIA compliant.

About the EEU Volume Event

Airlines will have the opportunity to purchase CORSIA Phase 1 eligible credits from the Guyana Jurisdictional REDD Program issued under the ART TREES Standard and supplied by Mercuria.

Airlines will be able to anonymously express their interest in the credits on the ACE platform. The purchase of the credits will be settled via the platform at the end of the event, with the option of using the IATA Clearing House or a Bank of America FBO (For Benefit Of) account set up in the airline’s name for the payment. Mercuria will also be able to provide transaction options for forward and multi-year purchases.

About CORSIA

CORSIA is the only global market-based measure scheme to address CO2 emissions from international aviation. CORSIA is implemented in three phases, with an initial voluntary period (2021-2026) followed by a mandatory phase starting in 2027 for most countries. The scheme also requires airlines to monitor, report, and verify their emissions to ensure transparency.

For more information on CORSIA, please refer to IATA’s CORSIA Handbook.


IATA further develops CO2 Connect for Cargo with British Airways and Microsoft

Miami – The International Air Transport Association (IATA) announced collaborations with British Airways and Microsoft to further enhance the accuracy of IATA CO2 Connect for Cargo in calculating carbon emissions. The announcement was made at the IATA World Sustainability Symposium (WSS), currently taking place in Miami.

British Airways will be contributing flight-level fuel burn data of its approximately 700 daily flights to IATA CO2 Connect. “At British Airways, transparency and consistency are essential to our sustainability efforts. By sharing our flight-level fuel burn data with IATA CO2 Connect, we’re enhancing the accuracy of CO2 emissions calculations and ensuring access, to reliable, clear information. It’s crucial for the entire industry to align on these standards, and collaboration is key,” said Carrie Harris, Director of Sustainability at British Airways.

Microsoft, building on its relationship with British Airways, will also contribute to the development of IATA CO2 Connect for Cargo by providing technical guidance and by becoming one of the first pilot testers of the service.

“Industry collaboration is essential for the decarbonization of aviation. Using CO2 Connect for Cargo will help Microsoft work with airlines to reduce emissions, make informed upstream investments with our partners, and purchase SAF and SAF certificates,” said Nico De Golia, Director of Sustainability for Microsoft Cloud Logistics. “This announcement showcases the potential impact when companies work to build a strong data foundation, driving the key actions needed to achieve our shared sustainability goals.”


These developments build on the March 2024 announcement that IATA is working with the Smart Freight Centre (SFC) in the development IATA CO2 Connect for Cargo.

“Strong relationships, including those announced today with British Airways and Microsoft, will help make IATA CO2 Connect for Cargo a more powerful and more accurate tool. The world is watching as aviation progresses on the challenging journey of decarbonization. Transparency and accuracy—enhanced by these partnerships—are critical.  Our common aim is to have the most accurate data about aviation’s carbon emissions. That will help the industry’s customers in managing and reporting their carbon footprints and it will inform the many strategic decisions that airlines will need to make for their own decarbonization,” said Marie Owens Thomsen, IATA’s Senior Vice President Sustainability and Chief Economist.

IATA CO2 Connect for Cargo will be available as of Q1 2025, distributed across quote & book systems, freight forwarders, shippers and airlines. It builds on the experience of IATA CO2 Connect which was launched in June 2022 to provide accurate and consistent carbon emissions calculations for passenger flights. IATA CO2 Connect uses primary data from more than 40 airlines (including British Airways) and an industry- endorsed calculation methodology (IATA Recommended Practice 1678). This differentiates IATA CO2 Connect from most tools/calculators that feed from theoretical data models.